Tesla Is Three Cars Behind Waymo in Texas. What Does That Prove?
By Dalton Skach · 4 min read
Three vehicles separate Tesla and Waymo on Texas’s automated-vehicle registry. That is a strikingly small gap. It tells investors how close the two companies are on one measure of fleet capacity, while leaving the harder question unanswered: how much business does each car earn?
Texas DMV’s public lookup showed 1,282 vehicles for Tesla Robotaxi LLC and 1,285 for Waymo LLC when checked on November 9. The state records independently support the totals circulated by community trackers the previous evening. They count listed vehicles, not cars simultaneously carrying paying passengers.1
The Whole Mars FSD Database records Tesla’s total rising from 1,244 to 1,282 on November 8, an increase of 38. Supercharged Daily’s November 9 roster analysis attributes the increase to Model Ys and reports a mix of 709 Model Ys and 573 Cybercabs. The public DMV table reviewed for this article displays VINs, without model labels, so that split remains attributed to the outside analysis.2
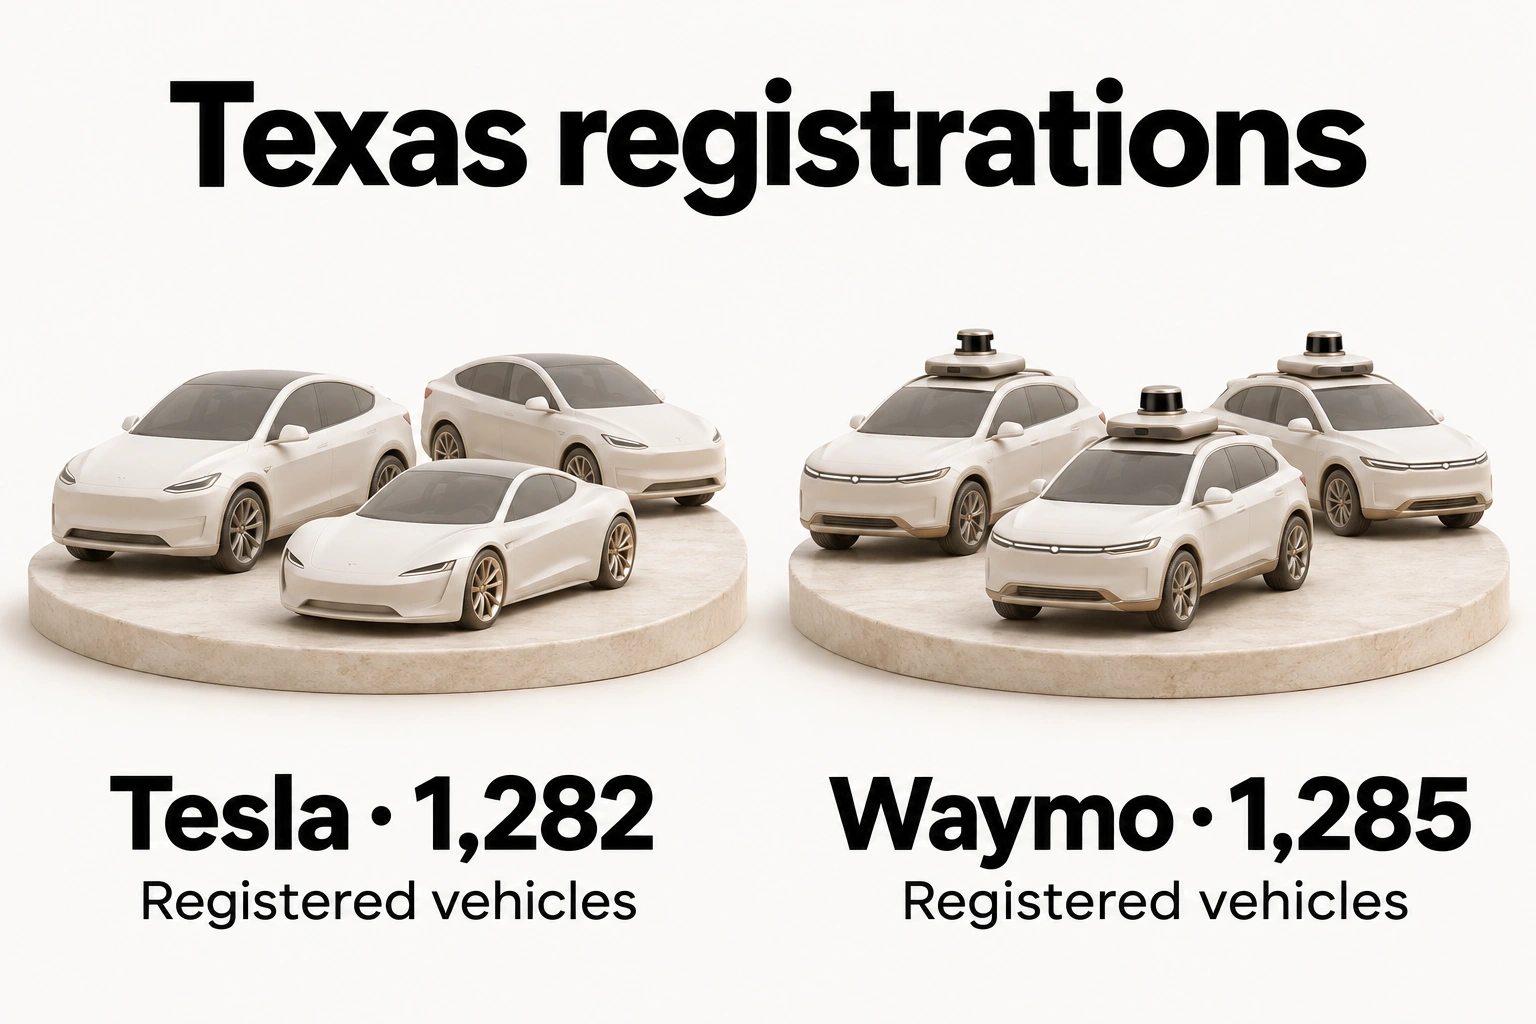
Tesla is three cars behind. Three additions would tie Waymo; four would put Tesla ahead, provided Waymo’s total did not change. The gap is roughly 0.23% of Waymo’s Texas count.3
What the near tie establishes
Texas is becoming a useful place to test Tesla’s ability to assemble a sizeable robotaxi fleet. A registry with nearly as many Tesla vehicles as Waymo vehicles makes the comparison more tangible than a launch announcement or a factory target.
It does not establish parity across the businesses. Waymo’s operations extend beyond Texas. In February, the company described a fleet of 3,000 vehicles overall, already well above the Texas total discussed here. That historical disclosure provides context, not a current November fleet estimate.4
Nor does a registration identify where a vehicle works, its daily availability or whether its miles generate fares. A parked car and a busy car can each occupy one row in the register. Counting them equally is appropriate for a vehicle inventory, but insufficient for a revenue forecast.
The missing link is utilization
Tesla has reported progress on the operating side. Its third-quarter update says Cybercabs began serving Austin and cumulative unsupervised Robotaxi miles approached two million by quarter-end. Those miles are a different measure from registered vehicles, and cumulative miles alone do not reveal current paid miles per car.5
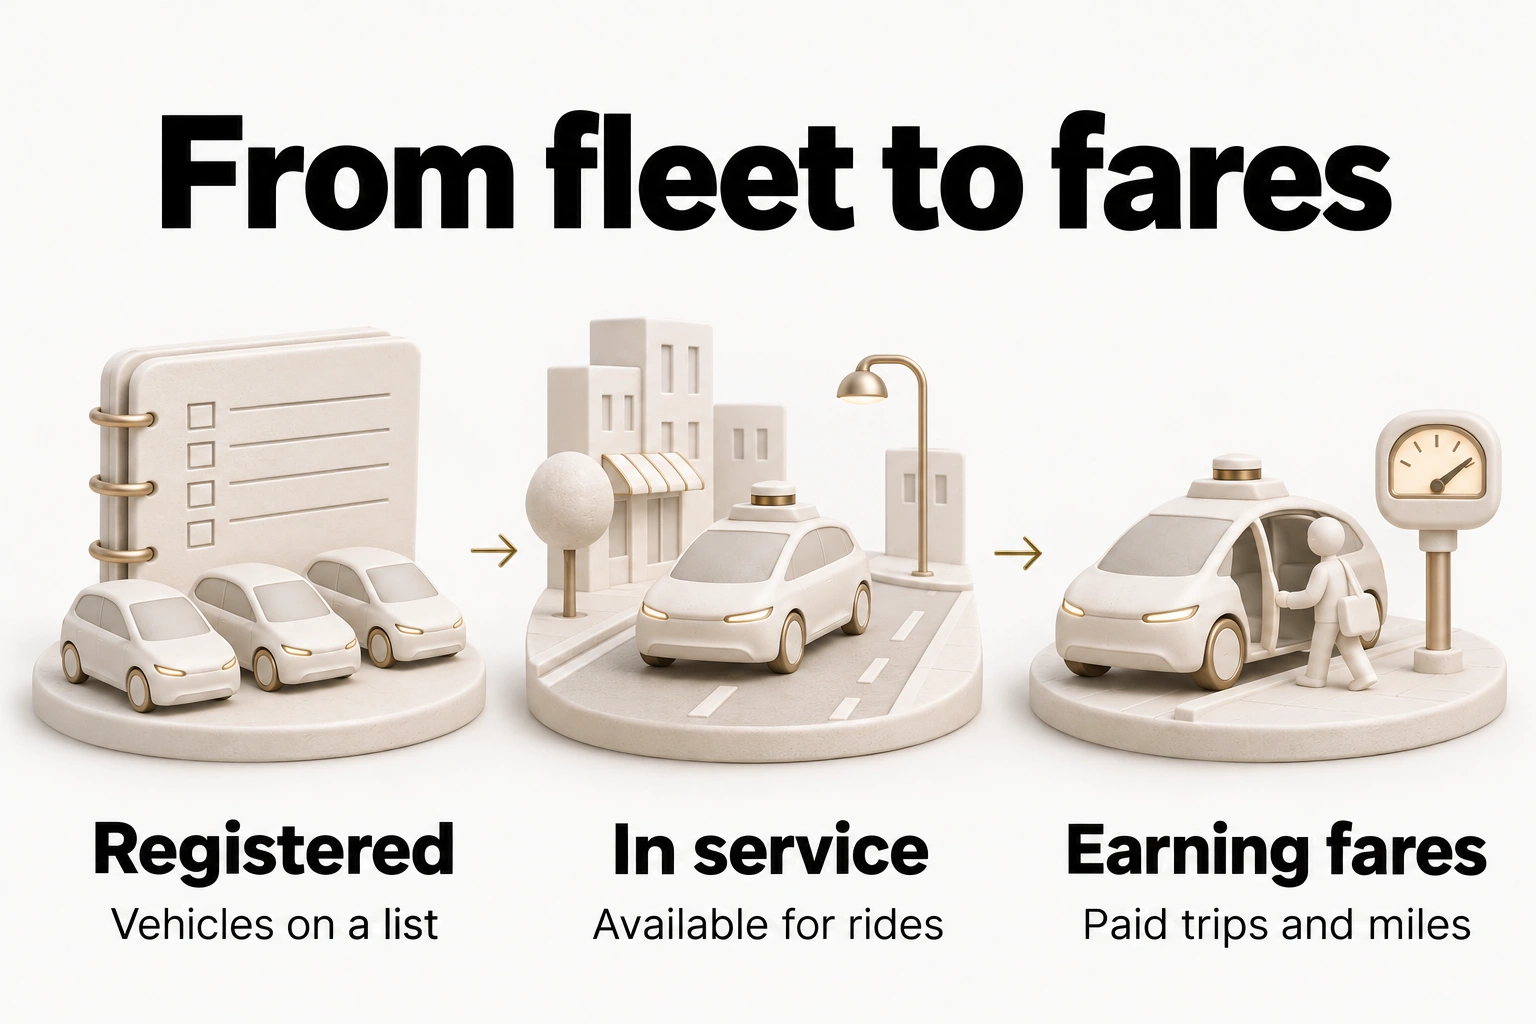
For an investor, the useful bridge runs from the average fleet available for service to paid miles per vehicle, then to the revenue retained per paid mile. Costs determine what remains: charging, cleaning, maintenance, insurance, remote assistance, depots and vehicle depreciation all matter. Adding vehicles can reduce waiting times and support more trips. It can also spread existing demand across more cars.
A simple sensitivity shows why the registration ranking is an incomplete signal. If an operator grows its average active fleet by 20% while paid miles rise only 10%, paid miles per active vehicle fall about 8.3%. That is an illustration, not an estimate for either company. Better fares or lower costs could offset the decline, but vehicle growth alone would not prove better economics.6
The investor takeaway
The near tie strengthens the evidence that Tesla is building a meaningful Texas fleet. It supports a larger capacity assumption; it does not by itself justify a higher revenue or profit forecast.
The next evidence I would want is comparable monthly paid miles, average active vehicles and operating costs in Texas. If Tesla puts more of its registered fleet into service while maintaining paid miles per car and improving costs, the registry growth becomes a stronger investment signal. Passing Waymo on the list would be a milestone. Earning more from the added cars would be the business result.
This article reflects Dalton Skach’s views as of November 9, 2026. It provides general research and does not offer personalized investment advice or recommend buying, selling, or holding a security. As of November 9, 2026, Dalton owns Tesla shares and has no position in Alphabet or Waymo. Editorial Standards & Disclosures · Terms of Use
Sources and calculations
- Texas DMV, Motor Carrier and Automated Motor Vehicle Operator Lookup, Vehicles tab, reviewed November 9, 2026: Tesla Robotaxi LLC, pagination showed 1,282 rows; Waymo LLC, 1,285 rows. Both pages showed Authorized status. These are live records and may change. Independent confirmation here means checking the displayed totals, not auditing every VIN or receiving company confirmation. ↩
- Whole Mars FSD Database, Texas Robotaxi Database, Fleet growth table, November 7–9 rows, accessed November 9, 2026. Tesla: 1,244 to 1,282; Waymo: 1,285 at both endpoints. Supercharged Daily, November 9, 2026, “Texas registrations” table and methodology: 709 Model Ys + 573 Cybercabs = 1,282. The publisher reports classifying VIN prefixes against an earlier labelled roster. BTF did not independently validate all model assignments or the precise evening update time. ↩
- BTF arithmetic: 1,285 − 1,282 = 3; 3 ÷ 1,285 × 100 = 0.2335%. With Waymo unchanged, 1,282 + 3 = 1,285 and 1,282 + 4 = 1,286. These are conditional comparisons, not forecasts. ↩
- Waymo, “Advice, not control,” February 17, 2026, paragraph discussing remote-assistance staffing and overall fleet size. The 3,000 figure is historical and is not presented as the November fleet count. ↩
- Tesla Q3 2026 Update, page 8, Robotaxi section. Quarter ended September 30, 2026. Company-reported cumulative unsupervised miles and Austin Cybercab deployment; not a Texas paid-mile or active-fleet reconciliation. ↩
- BTF illustrative sensitivity: paid miles per average active vehicle change = (1 + paid-mile growth) ÷ (1 + average active-fleet growth) − 1. Thus 1.10 ÷ 1.20 − 1 = −8.33%. Assumes comparable periods and fleet definitions. No fares, margins or company-specific probabilities are assumed. ↩
Artwork: original AI-generated conceptual hero and two sculpted-model illustrations created November 9, 2026. The imagined depot and miniature vehicles are not documentary evidence of either operator’s facilities or vehicle design. The thumbnail derives from the hero. Prompts and provenance are retained with the draft.